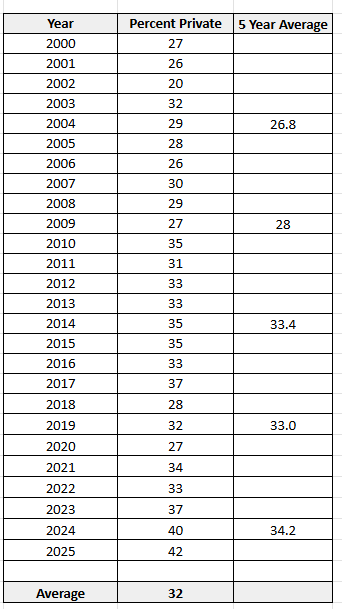
First, you must understand a very IMPORTANT NUMBER. According to the MHSAA, 14% of member schools are private schools. However, those schools win 32% of all the state titles. That proves that private schools have an advantage that must be equalized with a competitive balance plan like a separate playoff system or an enrollment multiplier. All of our neighboring states already have a competitive balance system in place. If you think the MHSAA should change the playoff structure get your school board to pass the Fair Playoffs Resolution.
All Sports (Data updated through the Spring of 2026)
- Since 2000, 32% of all state titles were won by private schools. That is more than twice as many titles as they should have won statistically, since private schools represent only 14% of MHSAA schools.
- Since 2000, 45% of state titles in the bottom half of divisions (based on enrollment) were won by private schools. That is three times more titles than they should have won statistically.
- In 2025, private schools won 42%, of all championships. This is the highest on record since 2000, the first year of our data. The lowest was 2002 when private schools won 20% of championships. The last 3 years have been record years for private school championships.
- The School of Choice law we operate under now was implemented in 199. Private schools win 13% more titles now than they did at that time. School of Choice law has not been an equalizer. Besides, private schools are 100% school of choice.
- These numbers indicate that private schools have some sort of advantage that public schools don’t have, and therefore the MHSAA needs to consider more than enrollment in pairing up schools for the playoffs.
Fall Sports
Boy’s Cross Country (Lower Peninsula)
- Since 2000, 18% of state titles were won by private schools. Private schools represent 14% of all schools fielding cross country teams.
- Private schools have won the last 2 Division 3 state titles and the last 3 Division 2 state titles.
Girl’s Cross Country (Lower Peninsula)
- Since 2000, 27% of state titles were won by private schools. Private schools represent 13% of schools that field a girl’s cross country team.
- A private school has won the last 4 Division 3 championships.
Football
- Since 2000, 40% of state titles have been won by private schools which represent only 9% of all schools that field football teams!
- Of teams with 5 or more state titles since 2000, 8 of the 13 are private schools. Those 8 teams have 55 state titles between them.
- Lopsided contests between private and public schools are not uncommon. Two of the biggest blowouts in state finals history have been private schools thrashing public schools. In the 2001 D5 title game, Jackson Lumen Christi beat an undefeated Livonia Clarenceville team 49-0. In the 2011 D7 title game, Saginaw Nouvel led an undefeated Pewamo-Westphalia team 56-12 at half time! In 2014 Warren DeLaSalle beat Muskegon Mona Shores 44-8.
- Private schools can still be successful playing against larger schools. In 2003, the private school Detroit DePorres won the Division 8 State Championship. They had an enrollment of 248 students. During the regular season they beat the eventual Division 1 State Champion Detroit Catholic Central 33-27. Detroit Catholic Central had an enrollment of 1,996 students.
Girl’s Golf ( Lower Peninsula)
- Since 2000, 34% of state titles were won by private schools. Private schools make up 11% of schools that field a girl’s golf team.
- Private schools have won the last 10 D3 state championships.
Boy’s Soccer
- Since 2000, 56% of state titles were won by private schools. Private schools only represent 15% of all schools that field a soccer team.
- Private schools have won the 135 of the last 17 state titles in Division 3.
- Private schools have won 24 of the last 27 state titles in Division 4. In fact, only one neighborhood public school, and one public charter school, have even appeared in the finals during that time.
- Private schools have won the last 5 D2 state titles.
Girl’s Swimming & Diving (Lower Peninsula)
- Since 2000, 28% of state titles were won by private schools. Private schools represent 8% of schools that field a girl’s swimming and diving team.
- Private schools have won the last 3 D2 state titles.
Boy’s Tennis
- Since 2000, 41% of state titles were won by private schools. Private schools represent 15% of schools that field a boy’s tennis team.
- Private schools have won the last 19 Division 3 titles.
- Private schools have won the last at least a share of the last 19 Division 4 titles.
Girl’s Volleyball
- Since 2000, 47% of state titles were won by private schools. Private schools represent 13% of schools that field a girl’s volleyball team.
- Private schools have won 19 of the last 23 Division 4 Championships
Winter Sports
Boy’s Basketball
- Since 2000, 30% of state titles were won by private schools. Private schools represent 13% of schools that field a boy’s basketball team.
- Private schools have won 15 of the last 18 Division 4 (or Class D) titles.
Girl’s Basketball
- Since 2000, 36% of state titles were won by private schools. Private schools represent 12% of schools that field a girl’s basketball team.
Boy’s Bowling
- Since 2000, 9% of state titles were won by private schools. Private schools represent 14% of schools that field a boy’s bowling team.
Girl’s Bowling
- Since 2000, 5% of state titles were won by private schools. Private schools represent 9% of schools that field a boy’s bowling team. In only 2 of 287 sports did the private schools win less than the number of state titles than they should have statistically.
Competitive Cheer
- Since 2000, 8% of state titles were won by private schools. Private schools represent 5% of schools that field a competitive cheer program.
Hockey
- Since 2000, 59% of state titles were won by private schools. Private schools only represent 17% of all schools that field a hockey team.
- A private school, Detroit Catholic Central, has won the last 7 titles in D1. A private school has won 3 of the last 4 in D2.
- In the smallest division, division 3, private schools have won 19 of the last 25 state titles.
Boy’s Skiing
- Since 2000, 6% of state titles were won by private schools. Private schools represent 19% of schools that field a boy’s skiing team. In only 2 of 27 sports did the private schools win less than the number of state titles than they should have statistically.
Girl’s Skiing
- Since 2000, 20% of state titles were won by private schools. Private schools represent 18 % of schools that field a girl’s skiing team.
- Private schools have won 8 of the last 8 Division 2 titles.
Boy’s Swimming & Diving (Lower Peninsula)
- Since 2000, 24% of state titles were won by private schools. Private schools represent 8% of schools that field a boy’s swimming and diving team.
Wrestling
- Since 2000, 11% of state titles were won by private schools. Private schools represent 6% of schools that field a boy’s wrestling team.
- The only private school to have won a wrestling title since 2000, is Detroit Catholic Central who has won 12 titles and had 3 runner up finishes. They have won the last 4 D1 titles. In 2018, they beat Brighton 57 to -1.
Spring Sports
Baseball
- Since 2000, 401% of state titles were won by private schools. Private schools represent 11% of schools that field a boy’s baseball team.
Boy’s Golf (Lower Peninsula)
- Since 2000, 54% of state titles were won by private schools. Private schools represent 15% of schools that field a boy’s golf team.
- Private schools have won the last 3 Division 1 titles.
- Private schools have won the last 6 Division 2 titles.
- Private schools have won the last 7 Division 3 titles.
- Private schools have won 9 of the last 10 Division 4 titles.
Girl’s Golf (Lower Peninsula)
- Since 2000, 34% of state titles were won by private schools.
- Private schools have won the last 4 Division 2 titles.
- Private schools have won the last 8 Division 3 titles.
- Private schools have won the last 3 Division 4 titles.
Boy’s Lacrosse
- Since 2005, 67% of state titles were won by private schools, the highest percentage for any sport. Private schools only represent 19% of schools fielding lacrosse teams.
- A private school has won 21 of 22 titles in Division 1.
Girl’s Lacrosse
- Since 2005, 23% of state titles were won by private schools. Private schools represent 18% of schools that field a girl’s lacrosse team.
- Private schools have won the last 4 Division 2 titles.
Girl’s Soccer
- Since 2000, 55% of state titles were won by private schools. Private schools only represent 15% of all schools that field girl’s soccer teams.
- Private schools have won the last 23 of 24 Division 3 state titles.
- Private schools have won 21 of the last 24 Division 4 state titles.
Softball
- Since 2000, 19% of state titles were won by private schools. Private schools represent 9% of schools that field a girl’s softball team.
Girl’s Tennis
- Since 2000, 44% of state titles were won by private schools. Private schools represent 18% of schools that field a girl’s tennis team.
- Private schools have won the last 16 Division 3 titles.
- Private schools have won 11 Division 4 titles
Boy’s Track & Field
- Since 2000, 21% of state titles were won by private schools. Private schools represent 12% of schools that field a boy’s track and field team.
- Private schools won 4 of the last 5 division 4 titles.
Girl’s Track & Field
- Since 2000, 16% of state titles were won by private schools. Private schools represent 12% of schools that field a girl’s track and field team.
Sports not included due to a limited number of years of data at this time or a limited number of teams that participate. Girl’s Wrestling, Boys Volleyball, Gymnastics, Girl’s Field Hockey. UP only divisions were not included as well.
Sources: The MHSAA
Double check my math on the Raw Data page.